1 Introduction
any critical decisions in business development, policy planning, and daily life can be framed as preferential choices: decisions made by picking out the most preferred option from a finite set of alternatives. Multi-criteria preferential choices occur when the alternative must be chosen according to a set of competing criteria. Selecting an alternative that performs well across all criteria is often impossible and instead tradeoffs must be carefully considered. There is significant evidence that people are poorly suited to such tasks [1]. Furthermore, preferential choices can involve one to many - multi-stakeholder decisions require understanding and balancing stakeholder preferences that may conflict. Multi-criteria preferential choices therefore pose challenging, complex problems for individuals and organizations alike.
In this work we present Web ValueCharts (WVC), a web-based software system to support multi-criteria preferential choices in both the single and multi-stakeholder settings. WVC enables individual and collective analysis of linear preferences models through interactive visualizations. Our goal in creating WVC is to make preferential choices more comprehensible, participatory, and engaging, thereby increasing stakeholder satisfaction in decision outcomes.
2 Background
Multi-Criteria Decision Analysis (MCDA) is the prescriptive branch of Decision Theory concerned with quantifying tradeoffs in multi-criteria preferential choices. Linear models are a formalism from MCDA that represent stakeholder preferences by assigning a $utility$, or measure of value to the stakeholder, to each alternative. A linear model is defined as follows:
Let $C$ be the set of criteria, and $A$ the set of alternatives. Then, a score function $s_{t}(c, a)$ is used to express the performance of alternative $a \in A$ under criterion $c \in C$ to a stakeholder $t$. These scores are normalized so that $s_{t}(c, a) = 1$ for the best alternative under $c$ and $s_{t}(c, a) = 0$ for the worst. A weight is also defined for each criterion, denoted $w_{t}(c)$, and encodes the importance of $c$ to $t$ relative to the other criteria. The sum of these weights is normalized to 1. Given a complete mapping of score functions and weights to criteria, the linear model computes the utility $u_{t}(a)$ as:
$[u_t(a)$ = $\sum_{c \, \in \, C}$ $w_t(c)*s_t(c,a)]$
There are several existing visualization systems that support stakeholders in exploring linear models. Our previous work on the ValueCharts [3] and Group ValueCharts [4] visualizations focused on the single and multi-stakeholder settings separately: ValueCharts supports inspection of just one linear preference model, while Group ValueCharts is designed for analysis of multiple models at the same time. Other software systems with visual encodings similar to ValueCharts and Group ValueCharts, such as LineUp [2], suffer from similar restrictions. WVC builds on ValueCharts and Group ValueCharts to create a software system that can support decision tasks across both settings.
3.1 The ValueCharts Visualization
The ValueCharts visualization displays criteria as rows and alternatives as columns. The height of each row is directly proportional to the weight assigned to the corresponding criteria in the stakeholder’s linear model $w_t(c)$. The cells where a row and column intersect represent the score of the column’s alternative under the row’s criterion ($s_t(c, a)$); a full cell reflects a score of one, while an empty cell reflects a score of zero. The stacked bar chart at the top of a ValueChart shows the total utility $u_t(a)$ for each alternative.
To refine their linear models, a stakeholder may adjust their weights by clicking and dragging on the dividers between row labels. Score functions can be changed by directly interacting with the scatter plot (continuous criteria) or bar chart (discrete criteria) in each row. Modifications to preferences are immediately reflected in the dynamic visualization. Sensitivity analysis (modifying models to understand how the most preferred alternative changes) is thus easily performed using ValueCharts.
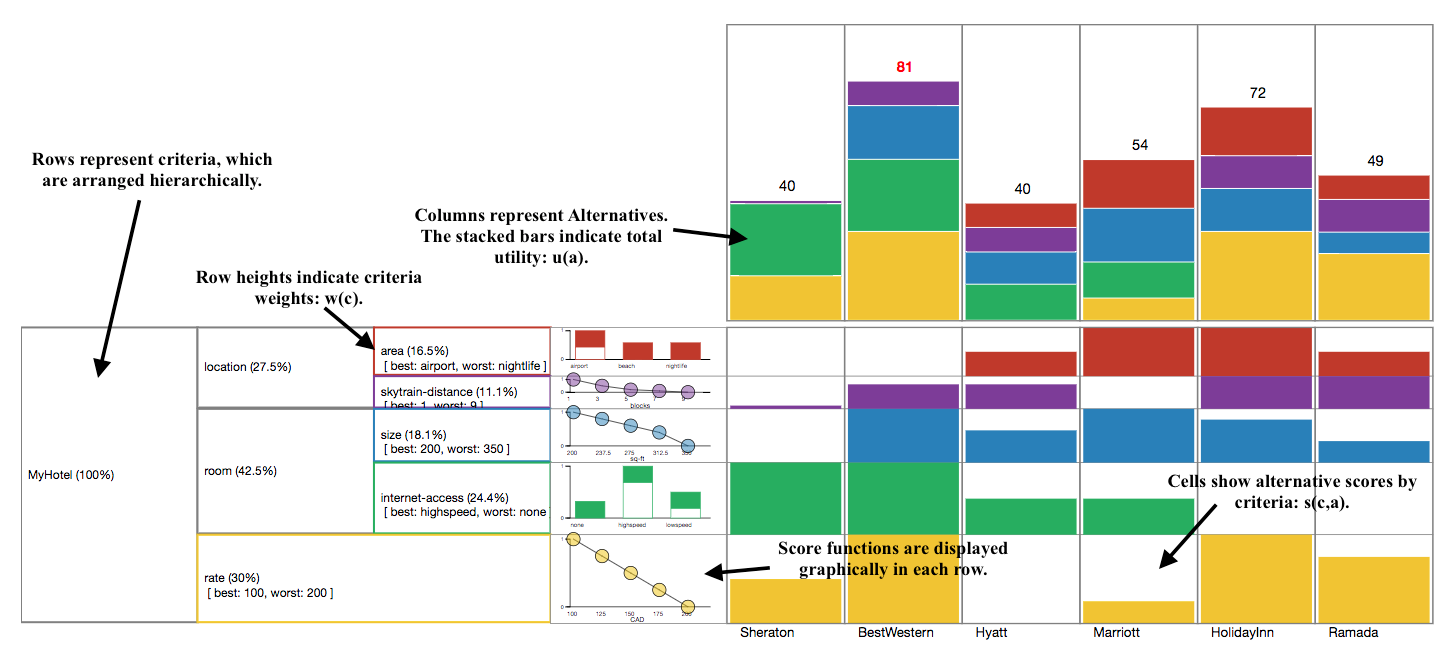
Figure 1: An annotated ValueChart for a single stakeholder trying to choose a hotel in Vancouver. The utility for the best alternative given the stakeholder’s linear model is clearly highlighted. Color is used to encode criteria.
3.2 The Group ValueCharts Visualization
Once satisfied, stakeholders participating in a group decision may submit their linear models to be included in a Group ValueCharts visualization (Figure 2). They are then allowed to view the $Group$ $ValueChart$ as well as the ValueChart corresponding to their own preferences through a simple toggle.
Group ValueCharts is designed to support comparisons between stakeholders’ preferences. It enables stakeholders to comprehend multiple, often conflicting, preference models simultaneously, and its visual encodings facilitate quick identification of disagreements. Group ValueCharts preserves the fundamental language of ValueCharts - criteria are displayed as rows and alternatives as columns. However, each row cell contains an additional bar chart of red outlines showing the distribution of weights assigned by stakeholders to the criteria. Note that row heights no longer encode criteria weights. Instead, they represent the maximum weight assigned to the criteria by a stakeholder. Additionally, each column contains one bar per stakeholder to indicate their scores $s_t(c,a)$ and utilities $u_t(a)$.
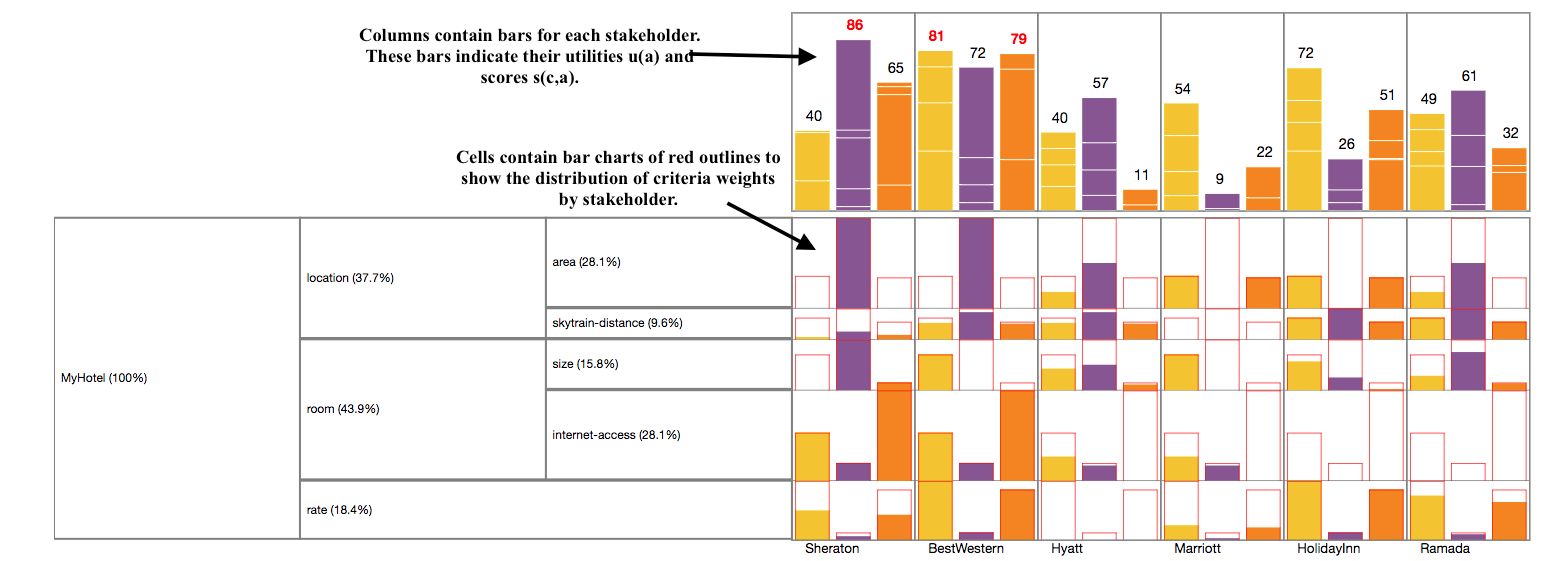
Figure 2: An annotated Group ValueChart for a three stakeholders collectively trying to choose a hotel in Vancouver. Notice that color is used to encode users instead of criteria as in a ValueChart.
4 Discussion
WVC implements a cycle of decision analysis at the single and multi stakeholder levels by combining the ValueCharts and Group ValueCharts visualizations and allowing users to easily transition between them. There is strong evidence that decision making is similarly iterative [1]. Past research has shown the effectiveness of ValueCharts and Group ValueCharts $independent$ of one another [5] [4]. We are confident that WVC’ combined and expanded functionality provides greater support for preferential choices. We are beginning a comprehensive task-based analysis of the application in order to demonstrate this.
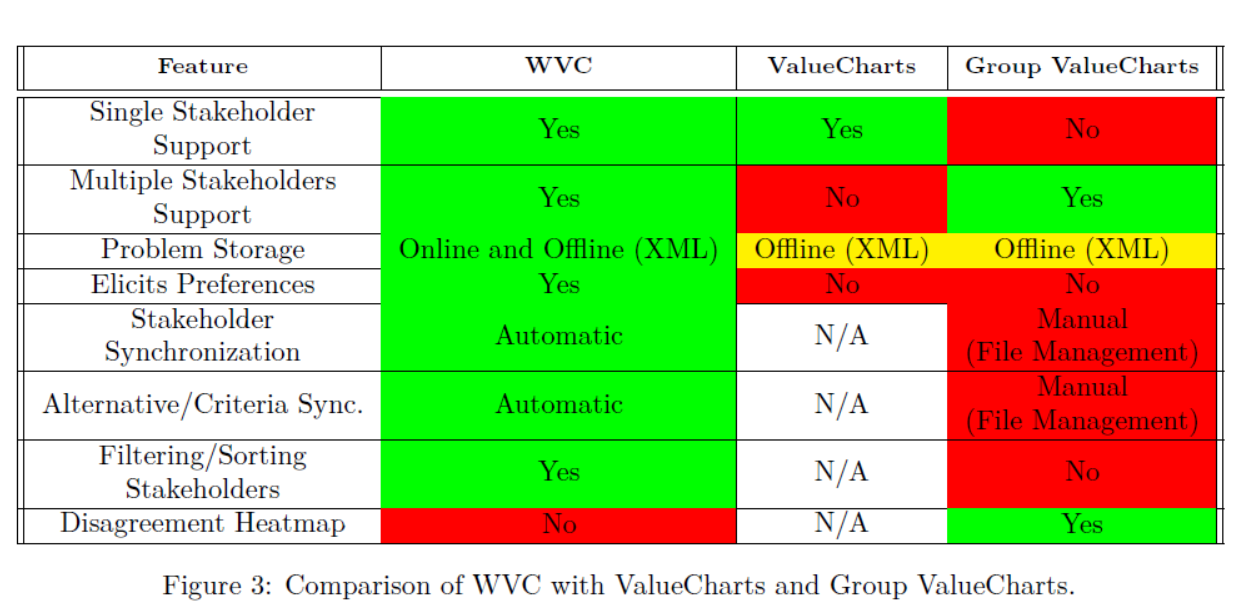
WVC’s web implementation is lightweight, accessible, and built with cutting edge web technologies including Angular, d3, and ExpressJS. Figure 3 contains a detailed comparison of WVC with ValueCharts and Group ValueCharts and reveals the decided benefits of a modern internet application. We are constantly improving the software, which is open source. We are also actively exploring new avenues of research, including a novel method for active learning in preferential choices based on Bayesian optimization and additive Gaussian processes.
Acknowledgements
I would like to express my very great appreciation to David Poole, Giuseppe Carenini, and Emily Hindalong for their excellent guidance. I would also like thank NSERC for funding this project.
References
-
Ralph L Keeney and Howard Raiffa. Decisions with multiple objectives:preferences and value trade-offs”. Cambridge university press, 1993.
-
Giuseppe Carenini and John Loyd. Valuecharts: analyzing linear models expressing preferences and evaluations.In Proceedings of the workingconference on Advanced visual interfaces, pages 150–157. ACM, 2004.
-
S. Bajracharya, G. Carenini, B.C. Chamberlain, K. Chen, D. Poole, H. Taheri,and G. Oberg. Interactive visualization for group decision-analysis. Unpublished manuscript, Department of Computer Science, University of British Columbia,Vancouver, Canada, 2017.
-
Samuel Gratzl, Alexander Lex, Nils Gehlenborg, Hanspeter Pfister, and Marc Streit. Lineup: Visual analysis of multi-attribute rankings.IEEE transactions on visualization and computer graphics, 19(12):2277–2286, 2013.
-
Jeanette Bautista and Giuseppe Carenini. An empirical evaluation of interactive visualizations for preferential choice. In Proceedings of the working conference on Advanced visual interfaces, pages 207–214. ACM, 2008.