I. Introduction
In many computer science programs, students encounter courses on databases, many of which use Sequential Query Language (SQL). However, most database management systems (DBMSes) which execute SQL do not provide the ability to step through parts of a query, making it difficult to pinpoint sources of error. In order to help beginners master the core of SQL, we built a visualizer which allows users to trace through the execution of one or more queries, similar to a debugger for other languages. The visual representation also makes it easier to understand more difficult aspects of the language, such as nested queries.
II. Visualization
Queries are decomposed into steps which are ordered according to the order of execution suggested by the PostgreSQL 9.3 documentation1. These steps are presented as a table of contents that the user can navigate (see ”Navigation Bar” in Figure 1).
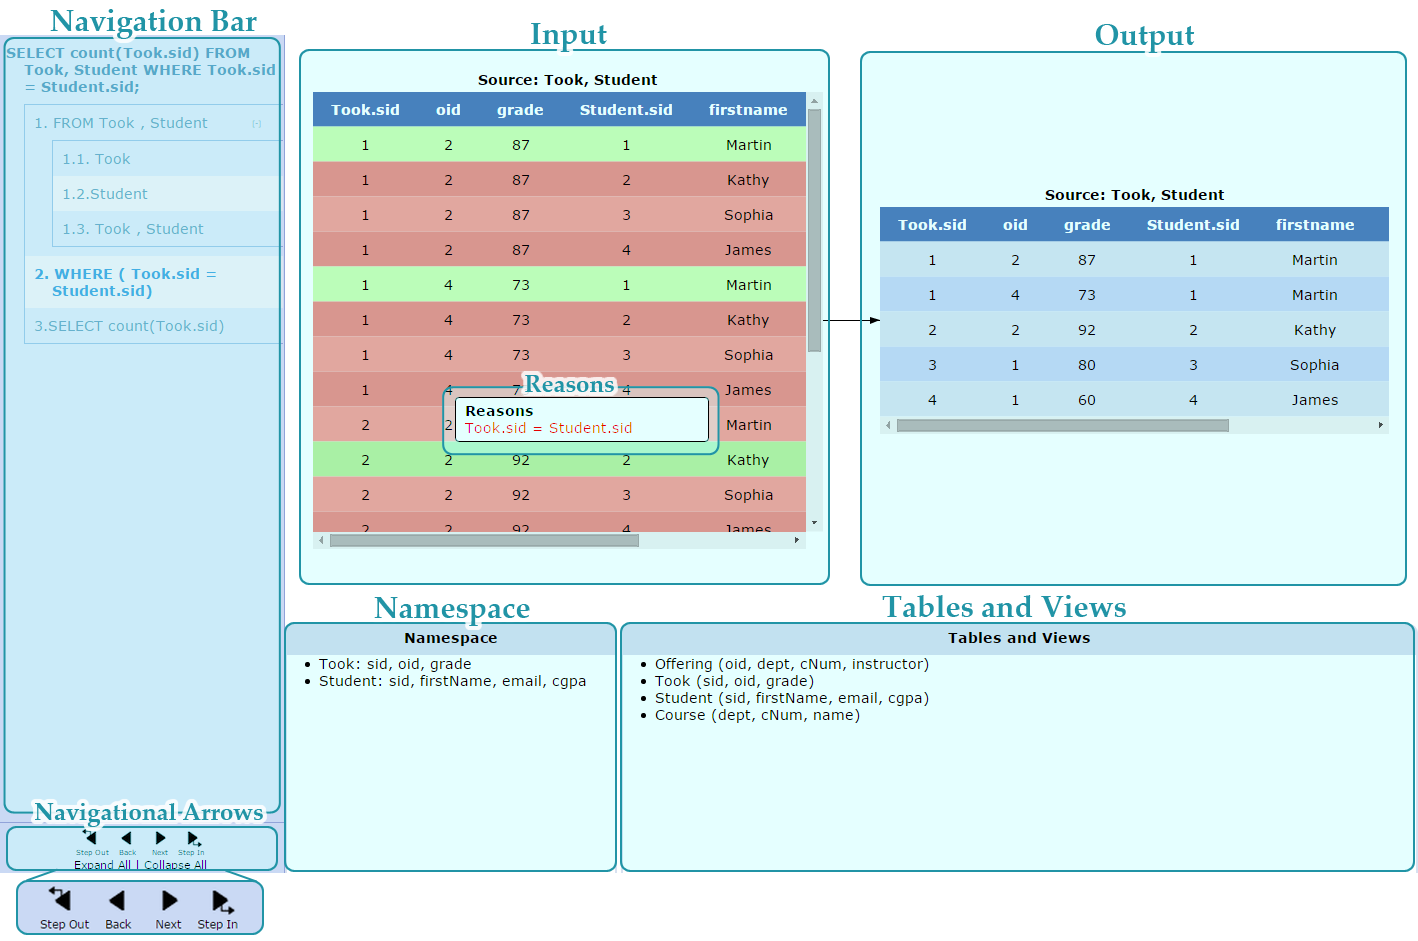
For each step, students can examine the table that the step produces (the output), the tables used to generate it (the input), and the attributes available (the namespace). To view a specific step, students can click on it in the navigation bar. Alternatively, the navigational arrows can be used to traverse steps chronologically.
The visualizer makes explicit the namespace of tables, views and attributes that can be referenced at any given time in the execution of a query. Consider the schema represented in the Tables and Views tab in Figure 1:
            Offering (oid, dept, cNum, instructor)

            Took (sid, oid, grade)

            Student (sid, firstName, email, cgpa)

            Course (dept, cNum, name)
and the query:
SELECT sid FROM Student;
The first step of the query is “FROM Student” which introduces the table ”Student” to the namespace, which becomes:
Student: sid, firstName, email, cgpa
Though other tables and their attributes exist, none of them can be referred to. In our example, “SELECT sid” would then pare down the namespace into:
Student: sid
However, including ”dept” in the SELECT clause would raise a syntax error. Even though “dept” exists in the schema, the visualizer clearly shows that it is not in the namespace and therefore cannot be referenced.
In queries with a WHERE clause, the reasons why certain rows of a table are kept may not be obvious. As a WHERE clause filters out rows that do not satisfy its conditions, displaying these conditions allows students to better understand why any given row is kept or discarded. The visualizer colours rows green if they are kept and red if they are not, as seen in Figure 1. By clicking on a row, the user brings up a tool tip which lists the conditions a row passed or failed, making the reasons it was kept or discarded explicit.
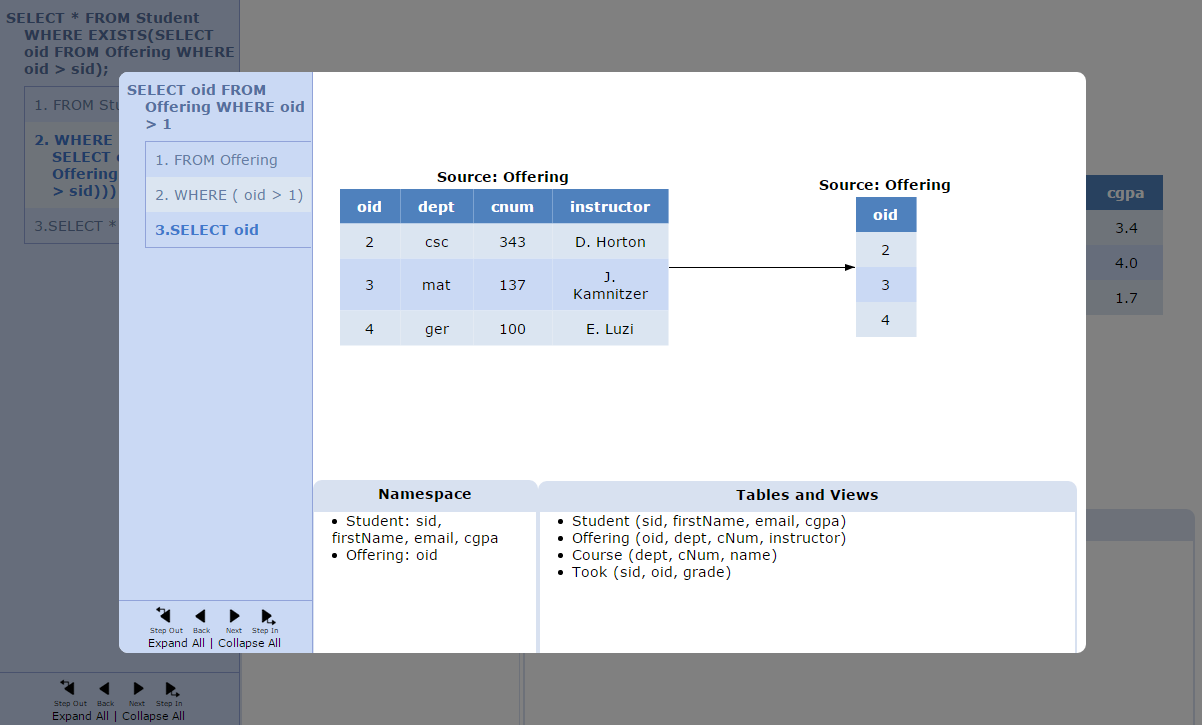
Nested queries can be difficult for students to understand. One challenge is discerning which attributes are referenceable in relation to the scope of a subquery. The user can choose to examine a subquery in a modal window that shows steps in a manner identical to the parent query, as seen in Figure 2. Although the subquery in Figure 2 only mentions the table “Offering” in the FROM clause, “Student” also appears in the namespace, as the parent query introduced it. The visualizer makes it clear that a subquery inherits its parent’s namespace. After returning to the parent query, the subquery’s namespace disappears, a behaviour analogous to function calls.
III. Software Architecture
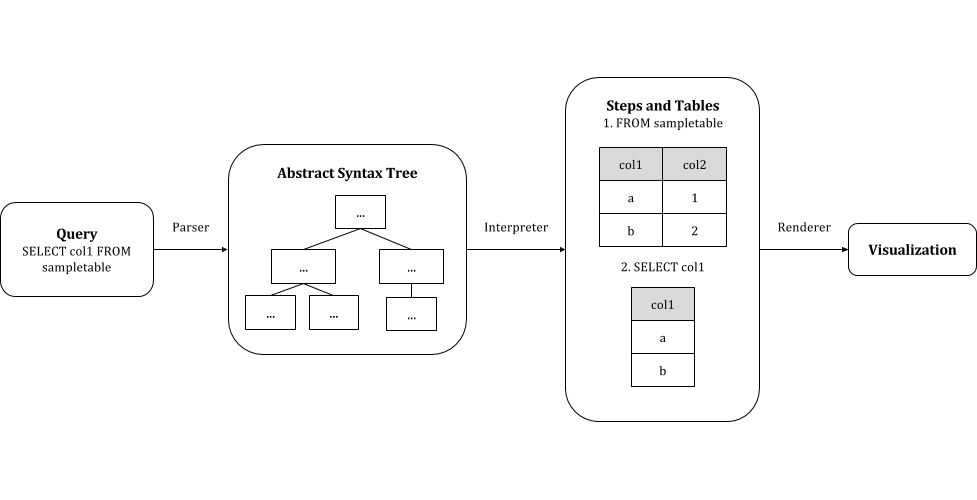
Our visualizer has three components: a parser, interpreter, and renderer. The parser, used to convert a query into an abstract syntax tree, was built by extending PyParsing’s SQL demo grammar according to the syntax supported by PostgreSQL 9.3. The abstract syntax tree is interpreted by our software to produce the steps involved in executing the query (according to the order of execution, as mentioned above), and the table resulting from the execution of each step. This information is then represented in JSON, from which a visualization is generated.
The query is processed all at once, creating every table before any visualization happens, as opposed to generating tables only when a user wants to see a step. At the cost of a slightly longer loading time, users gain the ability to explore or re-explore steps in any order without delay.
IV. Conclusion
Our visualizer breaks down queries, providing a clear image of how queries are processed to produce the final result. Although allowed in principle, advanced features of SQL, such as WITH clauses and multiple levels of nested subqueries, are not yet supported. The visualizer is intended for beginners, rather than thorough debugging, so its focus is on covering core features. Future endeavors include extending the visualization to handle relational algebra, as well as using the visualizer in the introductory database course at the University of Toronto.
http://www.postgresql.org/docs/9.3/interactive/sql-select.html↩