I. Introduction
As many as 300 million people worldwide are affected by rare diseases. These diseases are characterized by a prevalence of less than 1 in 1500 people, making them difficult to diagnose and treat. Finding a cohort of similar patients is necessary to determine the cause of a disease, but this is especially challenging because these diseases are rare and frequently misdiagnosed. One new approach is to find matching patients with similar phenotypes (symptoms), and allow their respective doctors to collaborate to determine the cause of the disease. We will explore a computational approach to this matching, propose a new variant of a standard algorithm for computing the similarity between two patients, and show that it performs slightly better than the existing method.
II. Approach
In order to match patients by their phenotypes, we must first establish a computable representation of a patient and these phenotypes. One approach is to use an ontology of standardized phenotype terms. In the Human Phenotype Ontology (HPO) [1], terms are organized as a directed acyclic graph (DAG), where each phenotype is a node, and each node has an "is a" relationship with each of its parents. For example, "ocular rupture" is a child of "abnormal eye morphology", which is a child of "vision/eye phenotype". We can represent a patient by looking at the phenotypes noted by their doctor and creating an equivalent set of nodes in the DAG. We can then match patients based on the semantic similarity between these sets. Many semantic similarity measures exist, but one of the most popular and accurate is simGIC [2]. The simGIC similarity score is calculated by weighting each node in the DAG by its information content (\(IC = - log\left( \frac{1}{p} \right)\), where p is the frequency of the node in a standard corpus of disease-phenotype associations) and then calculating \(\left( PA\ \cap\ PB \right)\ /\ \left( PA\ \cup\ PB \right)\), where \(PA\) is the set of all of patient \(A\)’s phenotypes and those phenotypes’ ancestors. Likewise for \(PB\) and patient \(B\). However, this calculation faces problems with incomplete IC measurements. We are only able to calculate an IC value for ~70% of nodes. Exponential back-off is a common approach to "smoothing" in situations where frequencies are needed but annotations are incomplete. Furthermore, exponential back-off weighting gives a higher weighting to nodes which were specifically annotated by a doctor than the parents of such nodes. This was the motivating factor behind Exponential Back-Off SimGIC (ebosimgic). In ebosimgic, we weight each observed node and subsequent ancestors by \(\frac{1}{k^{d}}\) where d is the minimum distance between the observed node and the ancestor and k is a constant (in this experiment, we found that \(k = 2\) seemed to work best). This means that the weight of an observed node is 1, its parent’s is 0.5, its grandparent’s is 0.25, and so on.
III. Analysis
| accuracy at top 1 | accuracy at top 5 | |
| simGIC | 0.58 | 0.74 |
| ebosimgic | 0.62 | 0.75 |
As shown in Table 1, exponential back-off weighting improves the performance among the most similar patients. It increases the percentage of patients for whom the most similar patient was a true match, while resulting in only a marginal increase in the percentage of patients for whom a true match was found in the top 5 most similar patients. At top 20 or more, simGIC and ebosimgic perform comparably.
We also found that ebosimgic and simGIC behave slightly differently when the HPO is pruned. We reduced the HPO by pruning nodes with high informational content. Since each node has an IC greater than its parents, this pruning operation can be done easily and still results in a DAG.
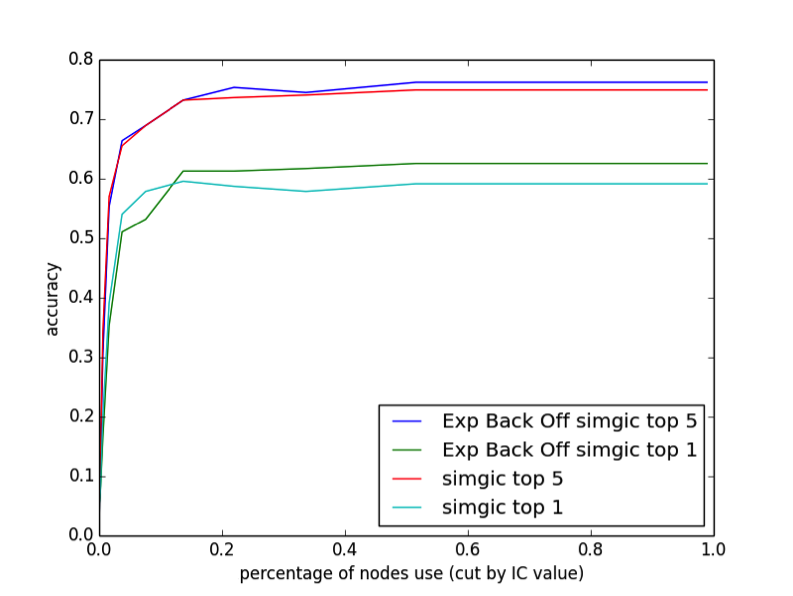
As illustrated in Figure 1, we find that removing up to 80% of the nodes in the DAG has almost no effect on the performance. This may partly be due to our relatively small sample size compared to the large number of phenotypes in the DAG, but it is apparent that both simGIC and ebosimgic are not taking full advantage of the level of detail provided in the DAG. The top 1 performance of simGIC is actually highest when 85% of the DAG is pruned, suggesting that high-IC nodes may contribute to false matches. Ebosimgic does not have this behavior.
IV. Conclusion
In summary, we find that we can improve the performance of rare disease-patient matching by weighting each node with an exponential back-off. We find that this modification of simGIC improves the results, increasing performance when evaluating based on top 1 similar patients, and slightly increasing performance on top 5. We also find that the vast majority of the nodes in the DAG do not affect performance, implying that current similarity measures are not taking full advantage of the level of complexity in the phenotype DAG. Furthermore, simGIC actually performs worse with all nodes included, while ebosimgic does not, suggesting that ebosimgic is making better use of the information available in the DAG.
References
[1] Robinson, P. N., Köhler, S., Bauer, S., Seelow, D., Horn, D., & Mundlos, S. (2008). The human phenotype ontology: A tool for annotating and analyzing human hereditary disease. The American Journal of Human Genetics, 83(5), 610-615. doi:10.1016/j.ajhg.2008.09.017 C.
[2] Pesquita, D. Faria, H. Bastos, A. E. N. Ferreira, A. O. Falcao, and F. M. Couto, "Metrics for GO based protein semantic similarity: a systematic evaluation," BMC Bioinformatics, vol. 9, supplement 5, article S4, 2008.